


“As we have discussed in earlier reports on the IEL site, there are basically three major water systems that can carry contamination away from the IEL site. These systems as surface water; starting on the east side of the site with Metzgers Ditch; regional subsurface ground water flow of dissolved volatile organic compounds (VOCs) and semivolatile organic compounds (SemiVOCs); and the deep, top of bedrock ground water flow of dense non-aqueous phase liquids (DNAPLs) which flow by gravity along the top of bedrock in the direction(s) of bedrock drainage. This third mechanism is controlled by gravity and may or may not have anything to do with the general direction of the two other systems.”
BENNET & WILLIAMS
ENVIRONMENTAL CONSULTANTS, INC.
2700 EAST DUBLIN-GRANVILLE ROAD • SUITE 400 • COLUMBUS, OHIO 43231-4054
TELEPHONE: (614) 882-9122 • FAX: (614) 882-4260 • 1-800-635-3810
September 14, 2006
Concerned Citizens Lake Township C/o Chris Borello 1900 Mt. Pleasant NE. Canton, Ohio 44721
Dear Chris;
RE: Existing digital drainage maps surrounding the IEL site
Per your request, please find enclosed three sets of all the available digital drainage maps that we have in house and/or have been able to obtain as they relate to the IEL site. These maps are the extent of the currently publicly available materials already in digital Geographic Information Systems (GIS) map conversions that do not require additional costs. More maps are being developed in the near future and additional maps exist in hard copy but have never been digitized. In addition, the maps showing all of the public utility rights-of-way, such as water lines, sewer lines, storm sewers, etc., do not exist in public forms and there is no indication when, if ever, they will be available.
Available Maps and What They Show
As we have discussed in earlier reports on the IEL site, there are basically three major water systems that can carry contamination away from the IEL site. These systems as surface water; starting on the east side of the site with Metzgers Ditch; regional subsurface ground water flow of dissolved volatile organic compounds (VOCs) and semivolatile organic compounds (SemiVOCs); and the deep, top of bedrock ground water flow of dense non-aqueous phase liquids (DNAPLs) which flow by gravity along the top of bedrock in the direction(s) of bedrock drainage. This third mechanism is controlled by gravity and may or may not have anything to do with the general direction of the two other systems.
In addition, the IEL site is located in a glacial geologic setting termed “Kame and Kettle”. This is one of the most complex hydrogeologic settings that exist in Ohio. In a kame and kettle setting, water (and contaminants) can drain off the upland kame surfaces into low kettle depressions. If the kettles are still filled with ponds and lakes, these represent the potentiometric (static) ground water level of that area. Many of these kettles have no surface drainage and only serve as local recharge points for the regional potentiometric (static) ground water flow directions. In other cases, like the kettle to the east of the IEL site, the kettle has been historically drained for agricultural uses and surface and/or underground agricultural tiles carry the drainage away. The kettle area east of IEL is drained by Metzgers Ditch.
Maps included in this Submission Packap_e
Surface Layer Maps
- Road and Survey grid maps from the Ohio Department of Transportation (ODOT). This data layer is a state data coverage and it has been clipped for the nine US Geological Survey topographic quadrangles included in the mapping layers. If you will note, the IEL site has a road right-of-way running through it. That is because the ODOT layer is slightly off of the survey points used for most of the rest of the state overlays. Since this map does not, in itself, show drainage, we are sending it along for general references only.
- A scaled down version of nine US Geological Survey Topographic Quadrangle maps in digital fonn. These maps exist in digital form for the whole state of Ohio. The nine that are shown here have the IEL site in the center of the map. The quadrangles used are as follows (from the northwest to the southeast); Akron West, Akron East, Suffield, Canal Fulton, North Canton (with IEL), Hartville, Massillon, Canton West, and Canton East. While it is not possible to absolutely trace the whole surface drainage pattern for Metzgers Ditch on these topographic quadrangle maps because some of the existing drainage links are missing, it appears that Metzgers Ditch eventually becomes part of the Nimishillen Creek watershed. Nimishillen Creek drains into Sandy Creek in northern Tuscarawas County, which in turn drains into the Tuscarawas River just south of Bolivar, Ohio. A very generalized surface flow direction is identified on one copy of this map by red arrows. The other maps that are clipped to this nine-quadrangle base have the same quadrangle and county lines located on them. This map can also be used to identify locations underneath the surface of the earth.
- The next set of maps is the surface water layer maps made available on the Stark County GIS web site. Someone digitizing an aerial photographic overflight probably made this map coverage. While it is useful in a very general way, since Metzgers Ditch drains into Summit County before moving back into Stark County, in the end it is not completely useful. We discuss options to improve this layer in a later section. In a very general way, we have added red arrows of surface water flow down Metzgers Ditch.
Subsurface Layer Maps
- This first layer is the Ohio Department of Natural Resources (ODNR) Division of Water Unconsolidated (Glacial) Aquifer Map of Ohio clipped for the nine-quadrangle area shown in the US Geological Survey Topographic Quadrangle maps. While this map basically just looks like a group of differently colored polygons, it will soon be one of the most important maps that we have supplied. This map shows the kinds of materials that the regional ground water is flowing through. To see this whole coverage discussed, go to the ODNR web site http://www.dnr.state.oh.us/water/samp/glacial_legend_settings.htm. We have made three copies of the information on that web page and included it as well. From that information you will see that the orange polygons (which include IEL), are classified as “Tsg” on the legend on the map coverage. The term “Fsg” translates to “Predominately till, contains sand and gravel lenses of varying thicknesses. These lenses may or may not be interconnected. Wells are developed in these lenses.” To the east in the kettle drained by Metzgers Ditch, there is an aqua polygon that is coded “Fsg”. The term “Fsg” translates to “Predominately fines with sand and gravel lenses. This setting is commonly found in valleys. Fines include alluvium, minor lacustrine (slackwater) deposits, till and colluvium.” When looking through the Aquifer settings, the IEL site is best described as “Outwash/kame”, which are “Areas containing mixture of sand, gravel, and till. Commonly associated with kames, eskers, and outwash areas not overlying major buried valleys.”As part of the ongoing US Geological Survey inventory of the Tuscarawas River Buried Valley Aquifer Watershed, ODNR Division of Water is in the process of constructing regional topographic quadrangle-based potentiometric surface maps for the whole basin. When we met with Mike Angle of the ODNR Division of Water to discuss the Stark County coverages, he indicated that these maps for Stark County should be finished in the next several months. Once these maps are completed and approved, they will become available from the ODNR web site. You can watch for these maps at http:/iwww.dnr.state.oh.us/water/gwpsurface/default.htm. With this Unconsolidated (Glacial) Aquifer Map and the new Potentiometric Surface Maps, you will be able to see the general direction of flow of the regional ground water moving away from the IEL site. This will give the general documentation of the regional direction of flow for ground water carrying VOCs and SemiVOCs.
- The green contour map is the digital Top of Bedrock map for the state of Ohio, which has been developed by ODNR’s Division of Geological Survey. This map shows what Ohio would look like if all the glacial materials were stripped off of the state. Because Ohio has two drainage histories, the Teays Age drainage history that happened before Ohio was glaciated and the glacial drainage history, in this part of Ohio, some of the major bedrock valleys show the northern drainage direction pf the Teays Age into what became Lake Erie and some of the valleys show reversed glacial drainage that flows south to the Ohio River. Notice that the IEL site sits on a bedrock saddle high between two drainage systems. The buried valley to the west still drains north towards Lake Erie. However, the valley to the east drains south. This bedrock valley also drains Wingfoot Lake in Portage County. These directions of flow are important for any DNAPLs that have moved out of the site since they were first placed there. These contaminating materials are heavier than water and so their direction of flow is driven by gravity. When they intersect porous bedrock, such as a sandstone in the valleys, they will then also move down into that bedrock through fractures and in between the pours of the rock. On one of the copies of the map we have drawn the two directions of DNAPL flow with red arrows.
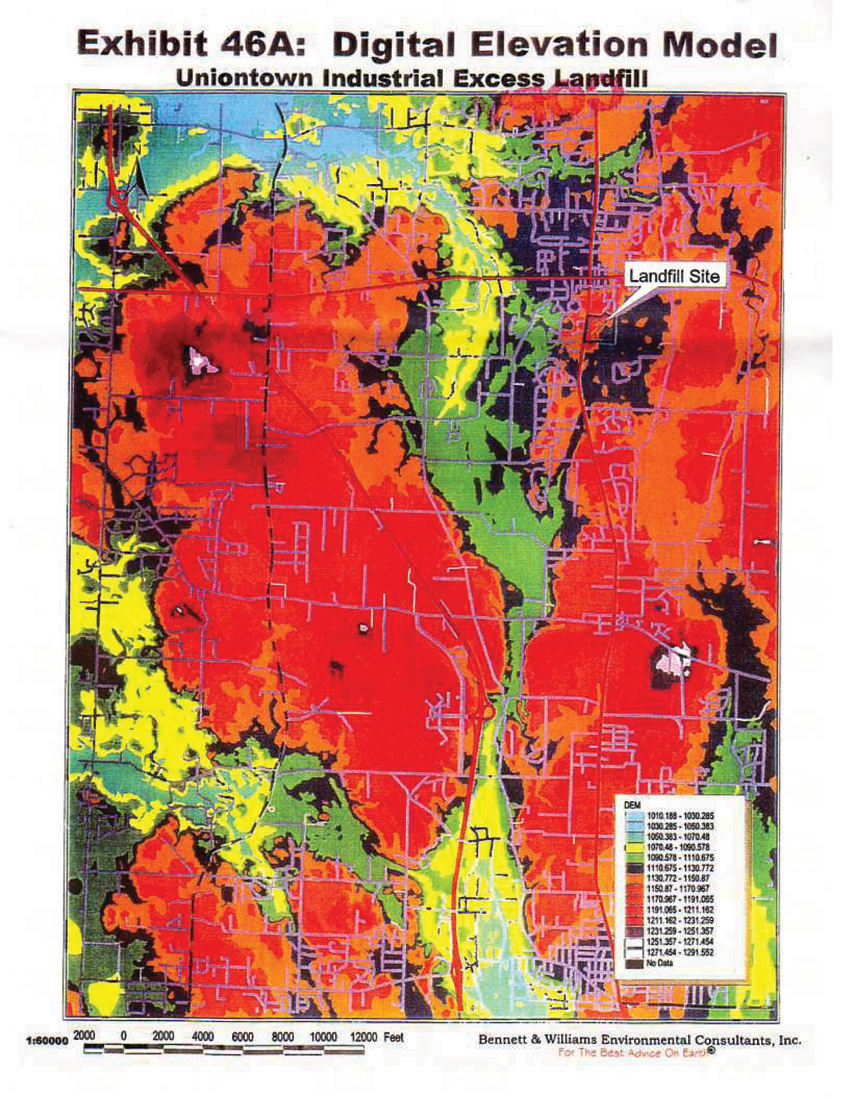
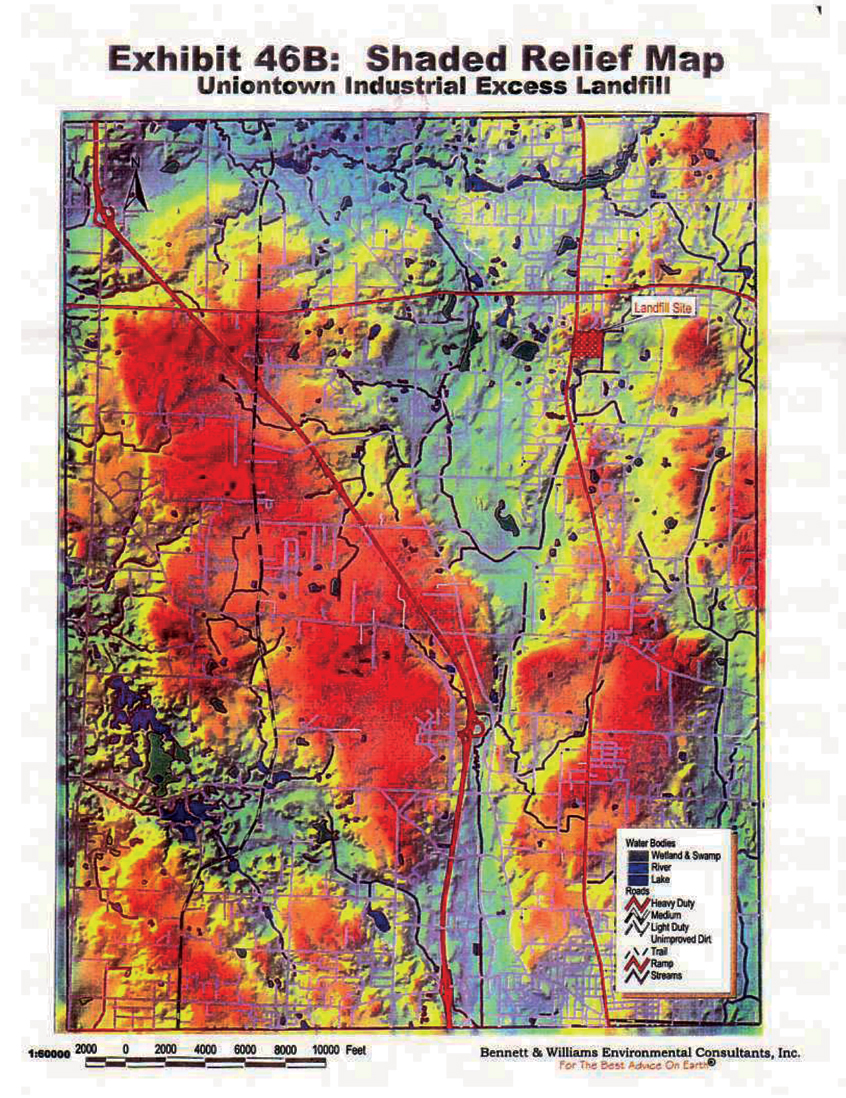
- The last highly colored big scale map is the digital elevation map of the Top of Bedrock map that Bennett & Williams made for the 1999 lake Township report addendum to US EPA. This map in it’s current version is the base map for Exhibit 46B, “Shaded Relief Map Uniontown Industrial Excess Landfill”. When this digital elevation map is sliced by surface elevations above mean sea level, it becomes the base map for Exhibit 46A “Digital Elevation Model Uniontown Industrial Excess Landfill”. This is a second-generation map and must be used in conjunction with the ODNR Top of Bedrock contour map. For accuracy, preference must be given to the ODNR Top of Bedrock contour map first.
- Exhibit 46A and Exhibit 46B are taken from the 1999 Bennett & Williams report to Lake Township, which was submitted to US EPA as part of the public comment period.
Level of Reliability of the Information
Both the current ODNR Top of Bedrock map and the Unconsolidated (Glacial) Aquifer Map, when coupled with the upcoming Potentiometric Surface Maps are at a very reasonable level of accuracy. To improve on this data, it would literally be necessary to remap the whole area again. Since the base data used for this effort would be the same used by ODNR, it is doubtful that the general pattern would be appreciably different. If there was an unlimited budget it could be done, but there isn’t so we would use these maps as our reference points and, indeed, we have for the 1999 report figures.
The surface drainage maps, however, are less than ideal. Part of the problem is the manner in which they were developed. An additional part is because only the data for Stark County is readily available. There is data available from Summit County as well but it has to be purchased and it is not readily apparent how much this will cost, nor is it clear if this data can be easily attached to the Stark County drainage layer. The web page for the Summit County Engineer: ARCIMS/GIS Information is Http://engineer.co.summit.oh.us.cgi-bin/display/Content.pl?type=section&id=251 There is no compatible data coverage for Portage County.
After reviewing the options, it is our opinion that the best set of drainage information available for the area is found on the respective map sheets of the soil surveys of the three counties which were physically mapped in the field during the three surveys. For reference: Christman, Richard L., et al., 1971, Soil Survey of Stark County Ohio map sheets 1, 2, 3, 7, 8, 9, 12 (and inserts), 13, 14, 15, 21, 22, 23, 24, 31, 32, 33, 34, 40, 41, 42, and 43; Ritchie, A, et al., 1974, Soil Survey Summit County Ohio map sheets 23, 24, (and insert), 27, 30, 31, and 34; and Ritchie, A, et al., 1978, Soil Survey of Portage County, Ohio map sheets 49, 50, 55, 56, 61, and 62 document the best existing information of surface water drainage in the area. It is possible to digitize this information and bring it into the same scale to overlay on the Unconsolidated (Glacial) Aquifer Map and the Top of Bedrock map. We have undertaken this effort for other projects. Basically this is a scan and digitize process but not all of the drainages on those map sheets would need to be digitized, only those that appear to be important to the IEL surface drainage site. Once those maps are completed, it is our recommendation that they be field verified by walking the ditches and creeks. If you are interested in undertaking such an effort at a later point in time under another grant, we would be pleased to estimate the costs for the scanning and digitizing effort. Walking the drainage should be a local effort, either by members of the group or by funding a summer college intern. Work would have to be coordinated with the Stark, Summit, and Portage Soil and Water Conservation Districts because of the right-of-entry issues.
In discussing the missing utility right-of-way transport systems with the Stark County GIS staffer, it became clear that not only do these information layers not exist in the public domain, there appears to be no plans to include that information in the near future. Since these information layers are either privately held and/or potentially the subject of “Homeland Security” protection, it is our opinion that this information could only be obtained under court order and possibly not even then. In addition, we are not able to obtain the locations of public well fields in the area because that information is also now protected under “Homeland Security”.
We have also included a CD that has the pdf files of all of the data layers except for the US Geological Survey Topographic Quadrangle files, which are extremely large. This concludes the work produced under this small contract. If you have questions and/or need further information, please feel free to contact us.
Respectfully submitted;
BENNETT & WILLIAMS ENVIRONMENTAL CONSLUTANTS INC.
Julie Weatherington-Rice, Phd, CPG, CS Sr.
Attachments 3 sets:
8 maps, 1 table, 1 CD
Copies: File